
Conversation with Andy Woodruff and Nick Swartsell
Belt talks to Andy Woodruff, cartographer, and Nick Swartsell, editor of Cincinnati in 50 Maps |
|
Nick, you edited this book, and Andy, you created the maps. Tell me about the process of collaborating to create a book that's both visual and linguistic. Did you find that together you could make something that offers more to a reader that either of you could individually? Andy Woodruff: Hopefully Nick agrees, but I think it was a good collaborative process! From day one Nick knew a lot of the stories he wanted to tell, and had about half of these map ideas already listed along with some data sources. Obviously I would not be able to make a book of Cincinnati maps without a local expert, but I did contribute some ideas from my own lesser knowledge of the city, as well as a few that just came from interesting data sets I ran across while working on other maps. The general process, besides all the back-and-forth brainstorming emails, was that I came up with maps based on the ideas and context from Nick, and then Nick wrote descriptive text in a way that both tells the story and reflects the particular way it’s shown on the map.Nick Swartsell: This was a great collaboration. Andy was great about taking my writerly, sometimes a bit nebulous ideas and working with me to nail them down with the specificity and precision maps require. The process of pitching something to him --- "could we pull this off?" and then working with him and his expertise to actually make it happen was really fun and unique. And writing the descriptions for the map ideas he came up with taught me new things about the city as well.
For each of you: what is your relationship to Cincinnati? AW: I grew up about an hour from Cincinnati in the Dayton suburbs—as a classmate of Cincinnati’s current mayor, in fact! As a kid I was a big Reds fan, and Cincinnati began to fascinate me as something of a “real city” that I didn’t see closer to home. When I first got into cartography I made a lot of maps of Cincinnati. I don’t live nearby anymore but remain a Cincinnati chili evangelist, and always enjoy stopping by when visiting home. NS: I was born up the road in Hamilton and grew up around Butler County. I spent a lot of time in the city growing up, though, skateboarding and going to punk shows or dance nights or whatever. I moved here in my 20s, moved away, moved back, the whole bit. I feel like I have both a little bit of an outsider's perspective but also some insider insights, too. I love the city and am sometimes frustrated by it in a way only a person who loves it can be.
Andy, you're also at work on the forthcoming Boston in 50 Maps. How much do the varied histories and personalities of these two cities affect your approaches to mapping Boston and Cincinnati? AW: In United States history, Boston has about a 160 year head start on Cincinnati, and is famously at the center of some pivotal moments, so it’s been more of a challenge with Boston not to spend all 50 maps on historical topics! Both the Cincinnati and Boston books use maps to show a lot of sides to the cities that people often don’t see or think about. But Boston is a place that’s more known for many things by many people from outside the city, so the maps are more interspersed with ones that cover the famous topics. Just as for Cincinnati we have “The Inevitable Chili Map,” for Boston I’ve got inevitable maps of Revolutionary War sites, universities, Patriots victory parades, and so on.
Nick, you also edited Belt's Cincinnati Neighborhood Guidebook. Tell me how these two projects are different and similar to you. Who will enjoy Cincinnati in 50 Maps?
I think a lot of the same folks who enjoyed the Cincinnati Neighborhood Guidebook will really like Cincinnati in 50 Maps. I'm looking forward to sitting down with both and bouncing back and forth between them, poring over the maps of the places people wrote about in the Guidebook. But I also think 50 Maps will appeal to people who are more visually oriented, as well as people who are looking for something that offers more straight-ahead data-based insights into Cincinnati.
The section in this book on Cincinnati's missing redlining map is striking. How do you approach investigating and communicating a history that has missing primary sources?
AW: Redlining maps only have four colors, but when you’re only working from a poor photocopy of a map with hand-written scribbles, it’s difficult to be sure you’re getting the colors right! When reproducing the map for our book, I tried to track down other people who have digitized the same draft map to see if my interpretation matched theirs. I’m pretty confident that we all got it right, but without an official published map it’s hard to be certain. NS: The history of redlining maps is a really important part of understanding cities like Cincinnati. While a final map of Cincinnati's redlined communities has yet to be found, the draft provides tantalizing clues about the shape of this racist policy. And lots of talented scholars have traced the legacy of redlining in Cincinnati using other data and tools, making it easier to understand.
What did you learn while working on this project that surprised you most? AW: I don’t know if I can name one specific thing, but working on a lot of the subjects that Nick came up with taught me things about a city that, it turns out, I only knew superficially. This doesn’t have to do with Cincinnati specifically, but I learned just how much geographic data state and local governments produce and publish. Most of these maps use data from government or other quasi-public agencies. The quantity of that data isn’t obvious outside those agencies, except to map nerds like me who are digging it up. It reflects really important work by public servants, and pretty much every local government decision that involves space or place has a lot of this data behind it. NS: The research into Cincinnati's pre-European history and its early roads and thoroughfares was really fascinating to me, and I learned a lot. I feel like there's still so much more to learn there.
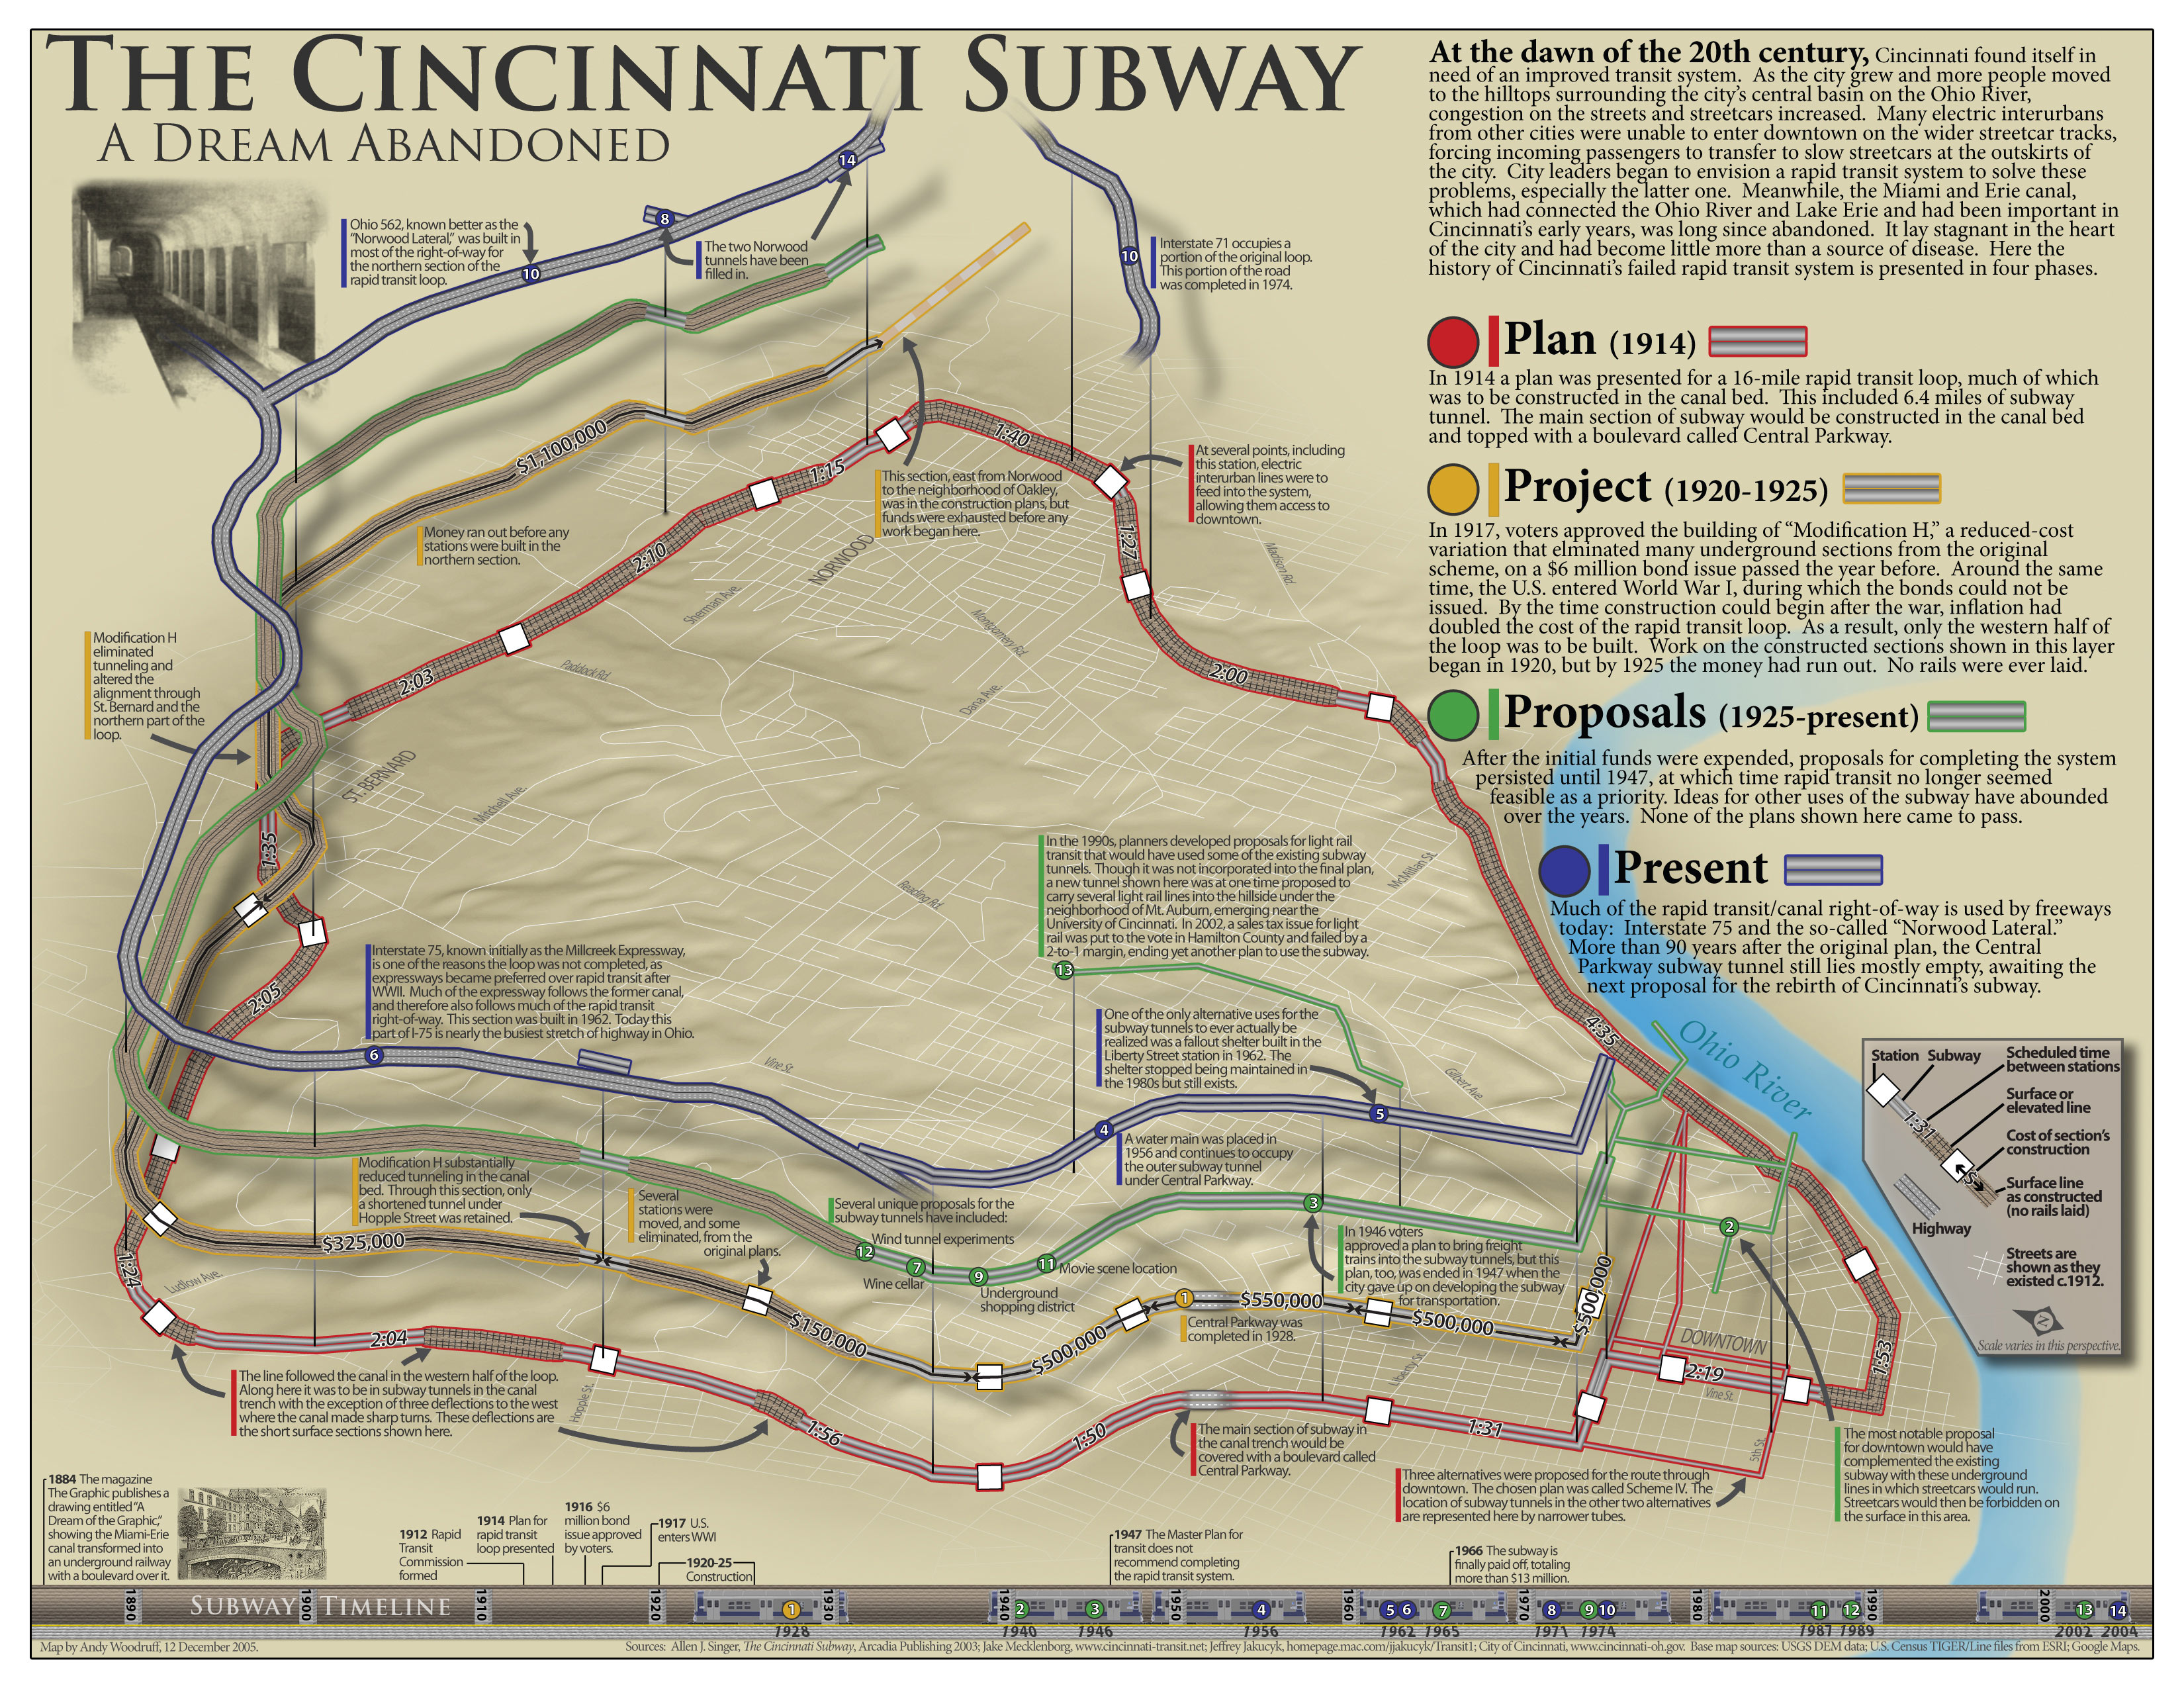
The map of Cincinnati's many downtowns is inventive and visually striking, which I love. Which sections or maps are your favorites and which posed to you the biggest challenges? AW: I’m grateful to the book’s designer, Glenn Ledoux, for breathing more life into the “many downtowns” set and most of the other maps! The abandoned subway map is a favorite for sort of nostalgic reasons: it’s a fascinating story that was the subject of one of my earliest proper attempts at telling stories through maps, as a student some 20 years ago. From a purely cartographic perspective, I really enjoyed making a diagrammatic map of the bridges crossing the Ohio River. The pair of maps on Mill Creek water quality was a bit of a design challenge. Changes in various measurements of water quality are numerically small but impactful on public health and wildlife. The numbers are the easiest way to show the improvement, but at the same time, it’s hard to make the numbers look as meaningful as they are. NS: I'm proudest of the section on environmental and health factors. Condensing all of the detailed data used to make many of those maps -- including some kinds of community information about where foraging is good -- was a really fun challenge to wrap my brain around. And I should note not something that could have happened without Andy's expertise. |
